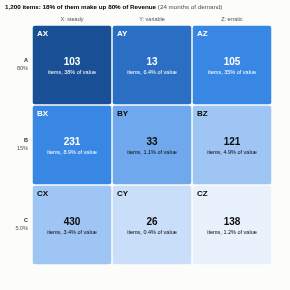
 ABC-XYZ Analysis
Thousands of products, nine ways to manage them. Classify every item by its value and by how predictable its demand is, and see where the stock, the risk and the effort should go.
Table visokio-agents
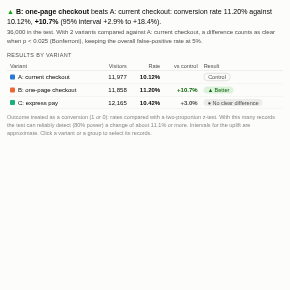
 A/B Test
Did the change work? Read experiment results correctly, with intervals, significance and a plain verdict, straight from your test data in an Omniscope report.
Bar visokio-agents
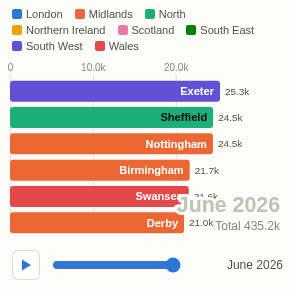
 Bar Chart Race
Turn a ranking over time into a story people watch to the end: who led, who overtook, and when.
Bar visokio-agents
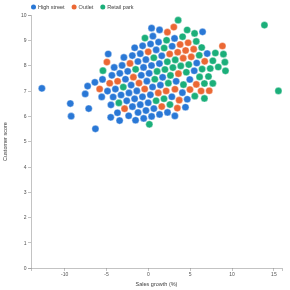
 Beeswarm
Every item as its own dot, none hidden behind another. The shape of a distribution, without losing the individual stores, people or orders that make it.
Line and scatter
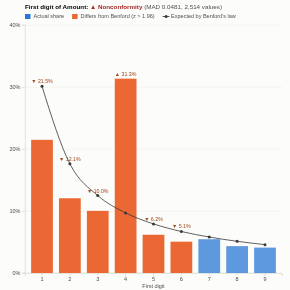
 Benford Analysis
Spot the numbers that do not look natural. Benford's law screening for payments, invoices and expense claims, with the groups that stand out and the records behind them one click away.
Bar visokio-agents
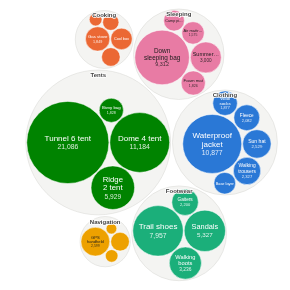
 Bubble Chart
Which few items make up most of the total? Packed bubbles sized by a measure, optionally grouped by category, so the big contributors stand out at once.
Diagram
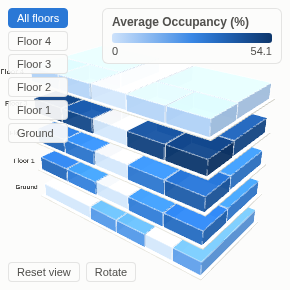
 3D Building
A live 3D model of your buildings, built from data: every floor and zone coloured by occupancy, temperature or energy, and one click from the readings behind it.
Diagram visokio-agents
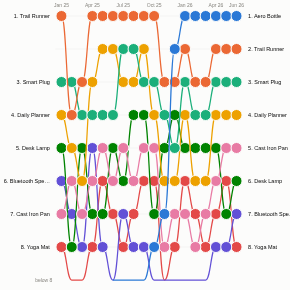
 Bump Chart
Who is top, who is climbing, who is slipping: the league table of anything, over time, in one picture.
Line and scatter visokio-agents
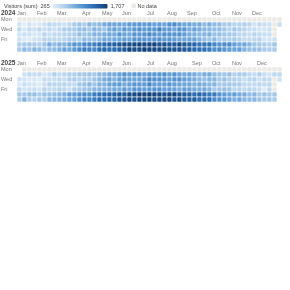
 Calendar
A year at a glance: every day coloured by a measure, for spotting weekly rhythms, seasons and one-off peaks.
Table
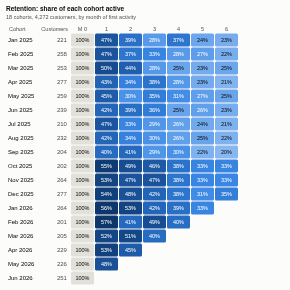
 Cohort Retention
Find out whether the customers you win this month are worth more than the ones you won last year. Point it at raw orders or logins; the cohorts, retention and lifetime value are worked out for you.
Table visokio-agents
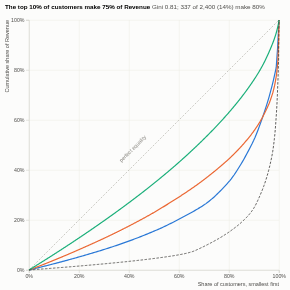
 Concentration
How much depends on how few? A Lorenz curve and the standard concentration measures for any total, with the largest items one click away.
Line and scatter visokio-agents
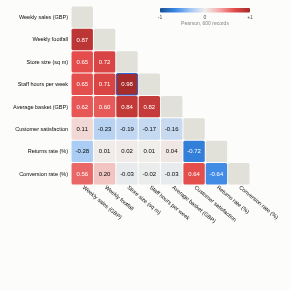
 Correlation Matrix
Which of your measures move together? See every relationship at once, then click into any pair to look at the records behind it.
Table visokio-agents
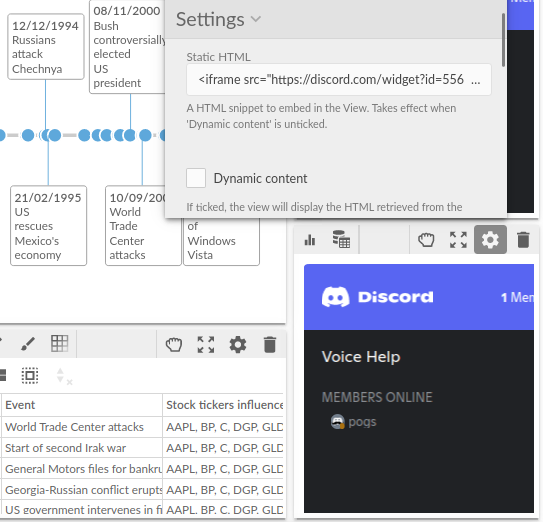
 Custom HTML
Your own HTML in a report: an embedded widget, formatted notes, or HTML cards held in the data that follow the filters.
Tool
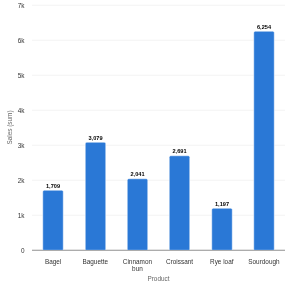
 Custom View Demo
A bar chart in under 200 commented lines: the worked example to read before writing your own custom view.
Bar
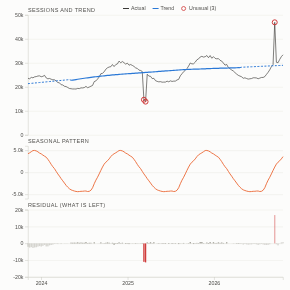
 Seasonal Decomposition
Is it growth, or is it just the season? Split any time series into trend, seasonal pattern and what is left over, and find the periods that were genuinely unusual.
Line and scatter visokio-agents
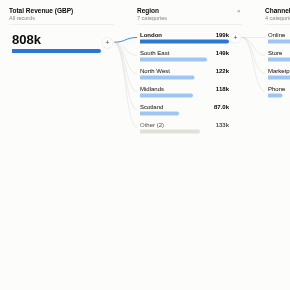
 Decomposition Tree
Ask "where does this number come from?" and answer it in clicks: split any total by any field, in any order, and let the view find the split that matters most.
Network visokio-agents
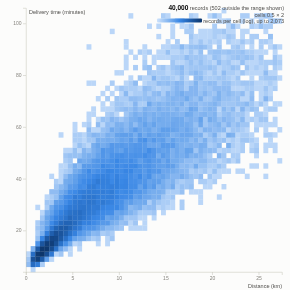
 Density Scatter
A scatter plot that stays readable at a million rows: the server bins the points, the view shows where they really are, and a box selects them.
Line and scatter visokio-agents
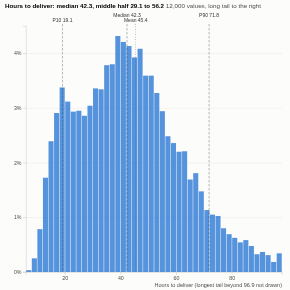
 Distribution
Averages hide the story. See the whole shape of any number, with the median, percentiles, tail and outliers spelled out.
Bar visokio-agents
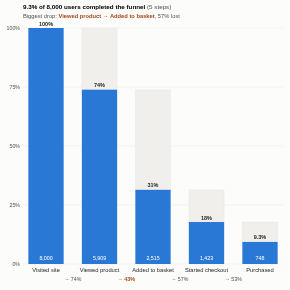
 Event Funnel
Where do people drop out? Conversion funnels from your raw event data, with drop-off, time between steps and comparisons by channel or device, in an Omniscope report.
Diagram visokio-agents
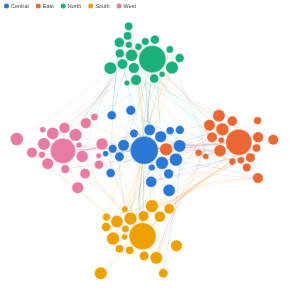
 Force Coordinate Graph
A network kept where your data puts it. Nodes at their own coordinates, links bundled into the flows they make.
Network
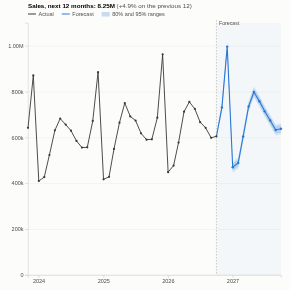
 Forecast
Where is this heading? A forecast for any measure in your data, with ranges, seasonality and a built-in check of how accurate it would have been, live in an Omniscope report.
Line and scatter visokio-agents
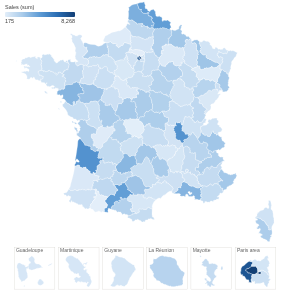
 France Choropleth
Every French department coloured by a figure from your data, overseas departments and Paris included, with a click to filter the report to one department.
Map
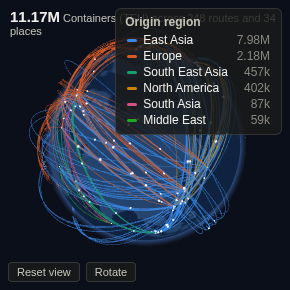
 Globe Flows
Put your supply chain, trade lanes or payment corridors on a living globe: every route drawn to scale, coloured by region, and one click from the records behind it.
Map visokio-agents
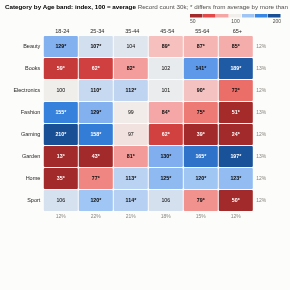
 Index Heatmap
Who over-indexes? A cross-tab that shows at a glance which combinations are more or less common than average, and which differences are real.
Table visokio-agents

JSON Tree
JSON stored in a field, opened up as a tree you can click through, one node per record.
Table
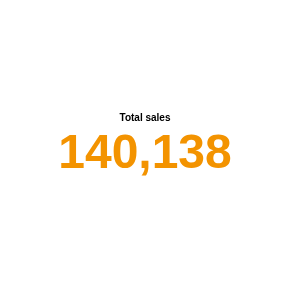
 KPI (custom view demo)
One number, one title. The headline figure of a dashboard, recalculated as the viewer filters the report.
Tool
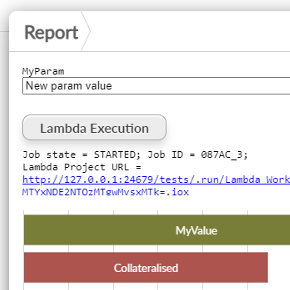
 Lambda Workflow Execution
Run the workflow with your own values, in a copy of the project, without changing the project.
Tool
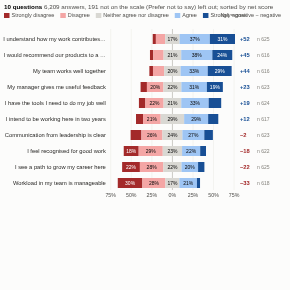
 Likert Survey
What do people really think? Survey results on a rating scale, centred on neutral, sorted by net score and split by any group, straight from the survey data in an Omniscope report.
Bar visokio-agents
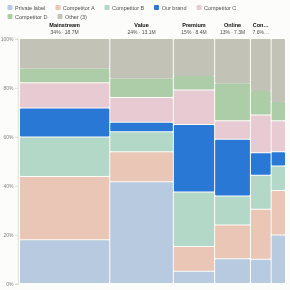
 Marimekko
The one-page market map: how big each segment is, who wins in each, and where your brand is strong or missing, in a single chart.
Bar visokio-agents
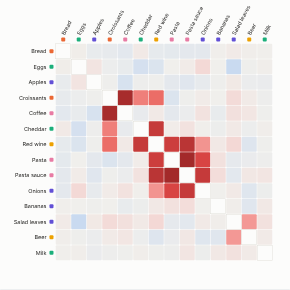
 Market Basket
Find out what sells with what. Point it at your order lines and see which products are bought together, how strongly, and in which baskets, with rules your merchandising and marketing teams can act on.
Table Network visokio-agents
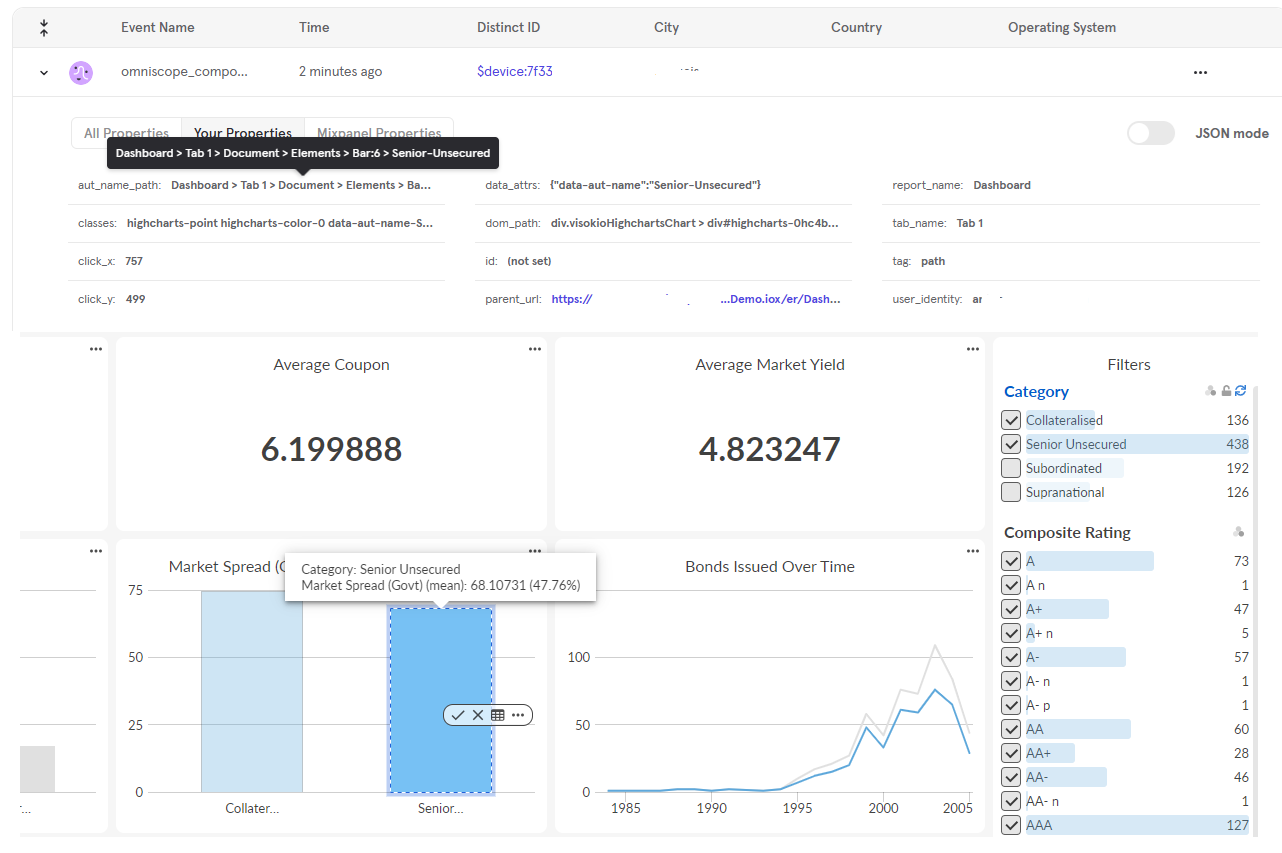
 Mixpanel tracker
Usage analytics for a report, in your own Mixpanel project: who opens it, which tabs they use and what they click.
Tool
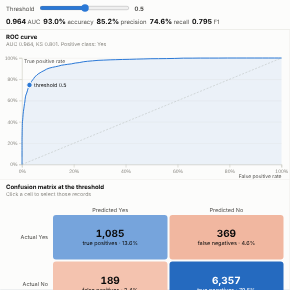
 Model Evaluation
See how good a model really is, and what any threshold means in practice: ROC, gains, distributions and the confusion matrix, all live, all linked to the records.
Line and scatter visokio-agents
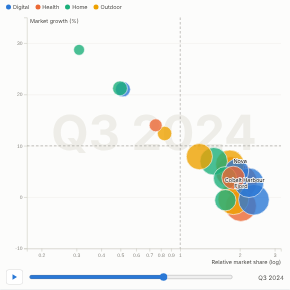
 Motion Bubbles
Watch your portfolio move. Every product, store or customer as a bubble, travelling through two dimensions over time, with trails that show where each one came from.
Line and scatter visokio-agents
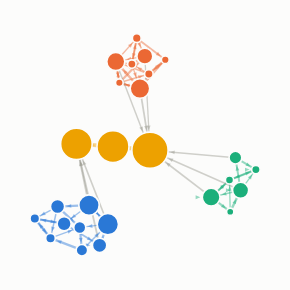
 Network Analyser
Turn any table of who-pays-whom, who-supplies-whom or who-talks-to-whom into a living network, with the communities, brokers and paths found for you.
Network visokio-agents
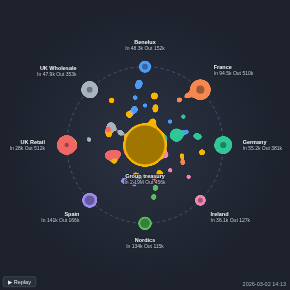
 Orbital Transaction Flow
A day of transactions replayed in seconds. Each one flies from sender to receiver, and the nodes grow with what they have sent and received.
Network
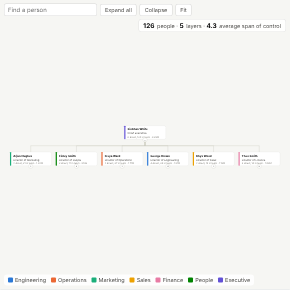
 Org Chart
The organisation as people actually see it: cards, teams and reporting lines, built live from your HR data, with team size and cost rolled up at every level.
Network visokio-agents
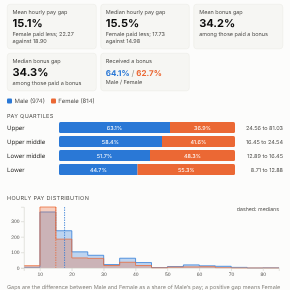
 Pay Gap
Understand your pay gap, not just report it. The gender pay gap measures reported in Great Britain, from employee data, with the quartiles, the distribution and a breakdown that shows where the gap comes from.
Bar visokio-agents
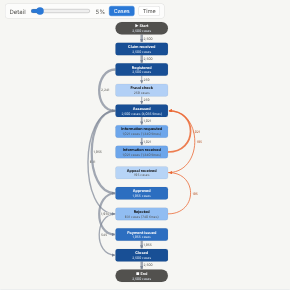
 Process Map
See how work really flows. Point it at an event log and get the process map, the rework loops, the slow handovers and the most common paths, mined live from your systems' data.
Network visokio-agents
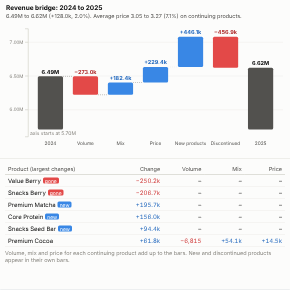
 Price Volume Mix
Revenue went up 2%. Was that price, volume, mix or new products? The bridge answers in one picture, and the table shows which products did it.
Bar visokio-agents
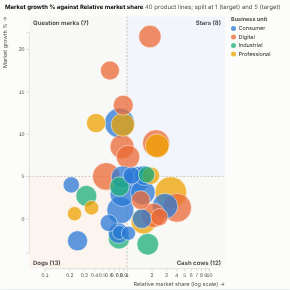
 Quadrant Matrix
Where should we focus? Any two measures, four named quadrants, and every item in its place, from live data in an Omniscope report.
Line and scatter visokio-agents
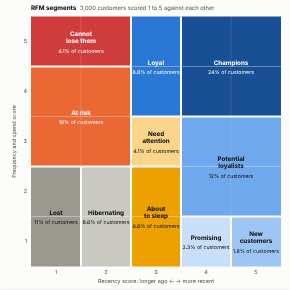
 RFM Segments
Know which customers to reward, which to win back and which you have already lost. RFM segmentation from your transaction data, live in a report, with the value of every segment and what to do about it.
Table visokio-agents
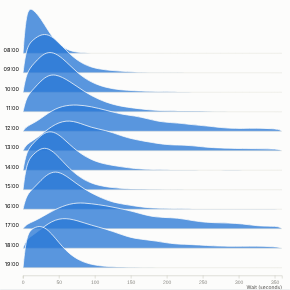
 Ridgeline
Averages hide the story. See the whole distribution for every group at once: where most values fall, how long the tail is, and which groups behave differently.
Line and scatter visokio-agents
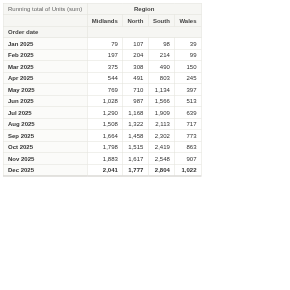
 Running Pivot View
Totals to date, period by period, side by side: a pivot table whose cells add up down each column.
Table
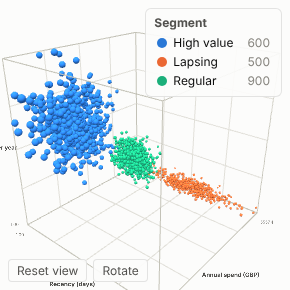
 3D Scatter
See your segments in three dimensions: rotate, zoom and click through thousands of customers, products or readings, coloured by segment and sized by value, inside any Omniscope report.
Line and scatter visokio-agents
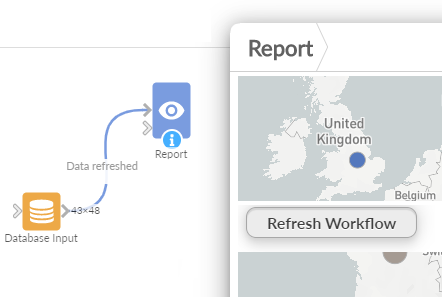
 Sequential Workflow Execution
A button in the report that runs workflow blocks one after another, in your order, and stops at the first failure.
Tool
 Set Parameters and Execute
Inputs for the project's parameters, and a button that runs the workflow with them. What-if analysis from the report.
Tool
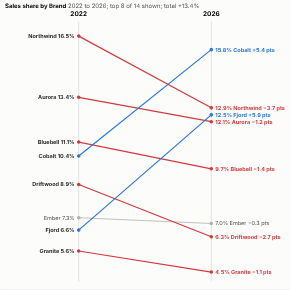
 Slope Chart
What changed between then and now? Every item's start and end on one chart, with the winners, the losers and the reshuffles obvious at a glance.
Line and scatter visokio-agents
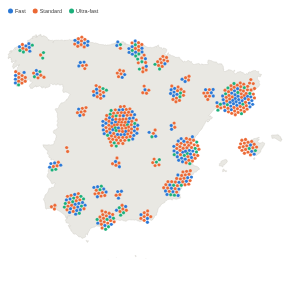
 Spain Force Dot Density Map
Every site, customer or incident in Spain as its own dot, none hidden behind another. How many there are in each place, at a glance.
Map
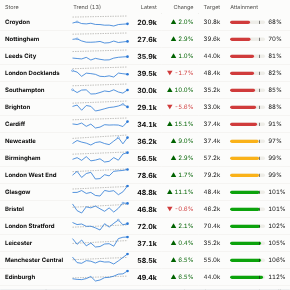
 Sparkline Scorecard
The weekly review on one screen: every store, product or region with its trend, its number, its change and whether it is on track, sorted so the problems are at the top.
Table visokio-agents
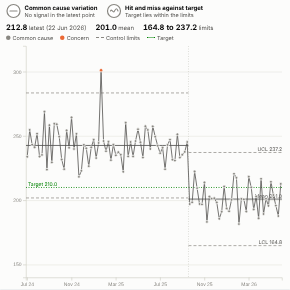
 SPC Control Chart
Stop reacting to every wiggle. See which changes in a measure are real, which are noise, and whether the process will hit its target, with the statistics done for you.
Line and scatter visokio-agents
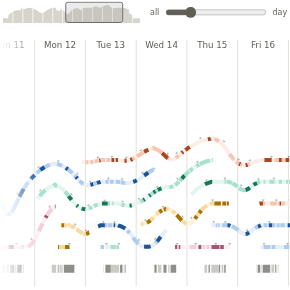
 Strata
Things that open and close - tickets, sessions, projects, patients on a ward - as a stack of lines over time. How much was open at each moment, and what each one was doing.
Line and scatter
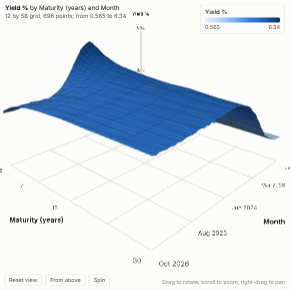
 3D Surface
See the shape of your data. Any measure over two dimensions, drawn as a 3D surface you can rotate, zoom and click, live in an Omniscope report.
Diagram visokio-agents
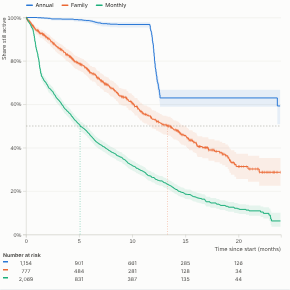
 Survival Curve
How long do customers stay? How long do machines last? Survival curves answer "time until" questions correctly, including the records that have not ended yet, and show whether the difference between groups is real.
Line and scatter visokio-agents

 Switch Param
Radio buttons that set a project parameter, chosen from a field's values.
Tool
 Switch Param and Execute Workflow
Pick a value, and the workflow re-runs with it: a parameter switch for reports built by a parameterised workflow.
Tool
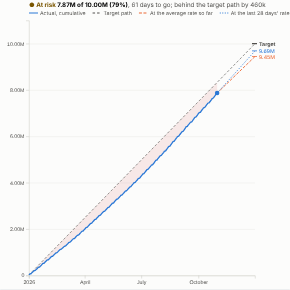
 Target Tracker
Will we make it? Progress against a target, the projection to the end of the period, and the rate needed from here, live from your data.
Line and scatter visokio-agents

3D Force Graph
A network you can turn in your hand. Links between people, accounts or products, laid out in three dimensions so the clusters and the nodes that join them stand out.
Network
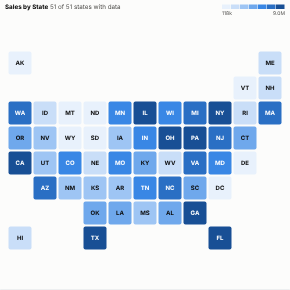
 Tile Map
Every region gets a fair share of the picture. One tile per US state or UK region, coloured by any measure and labelled with its value, for regional reporting that reads at a glance.
Map visokio-agents
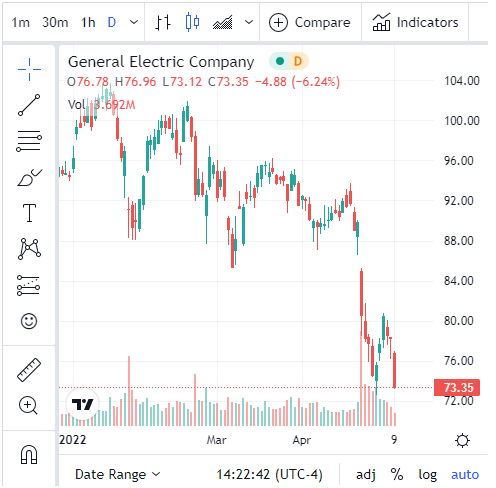
 TradingView
A market chart for the symbol in your data. TradingView's Advanced Real-Time Chart, driven by the record the viewer filters or selects in the report.
Line and scatter
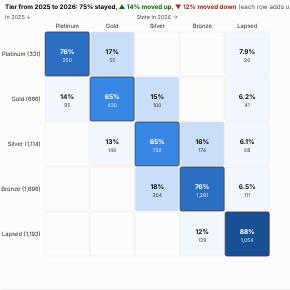
 Transition Matrix
Where did they go? See how customers, accounts or loans moved between tiers, segments or ratings from one period to the next, and who made each move.
Table visokio-agents
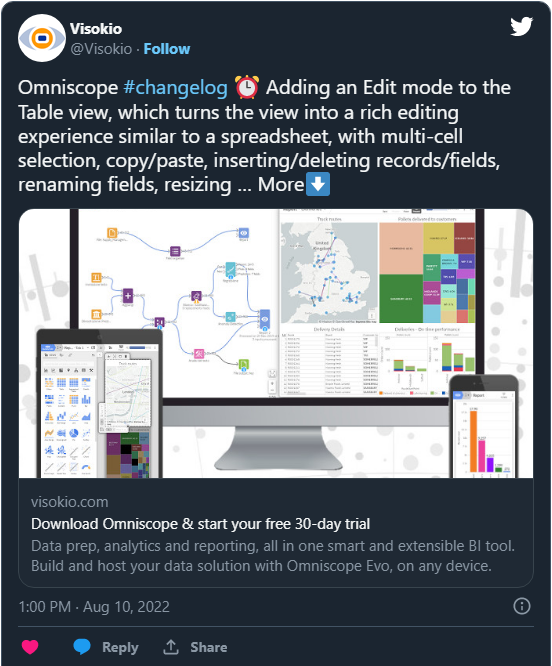
 Twitter View
The post behind the number. Embeds a post from X (formerly Twitter) in a report, chosen by the record the viewer filters or selects.
Tool
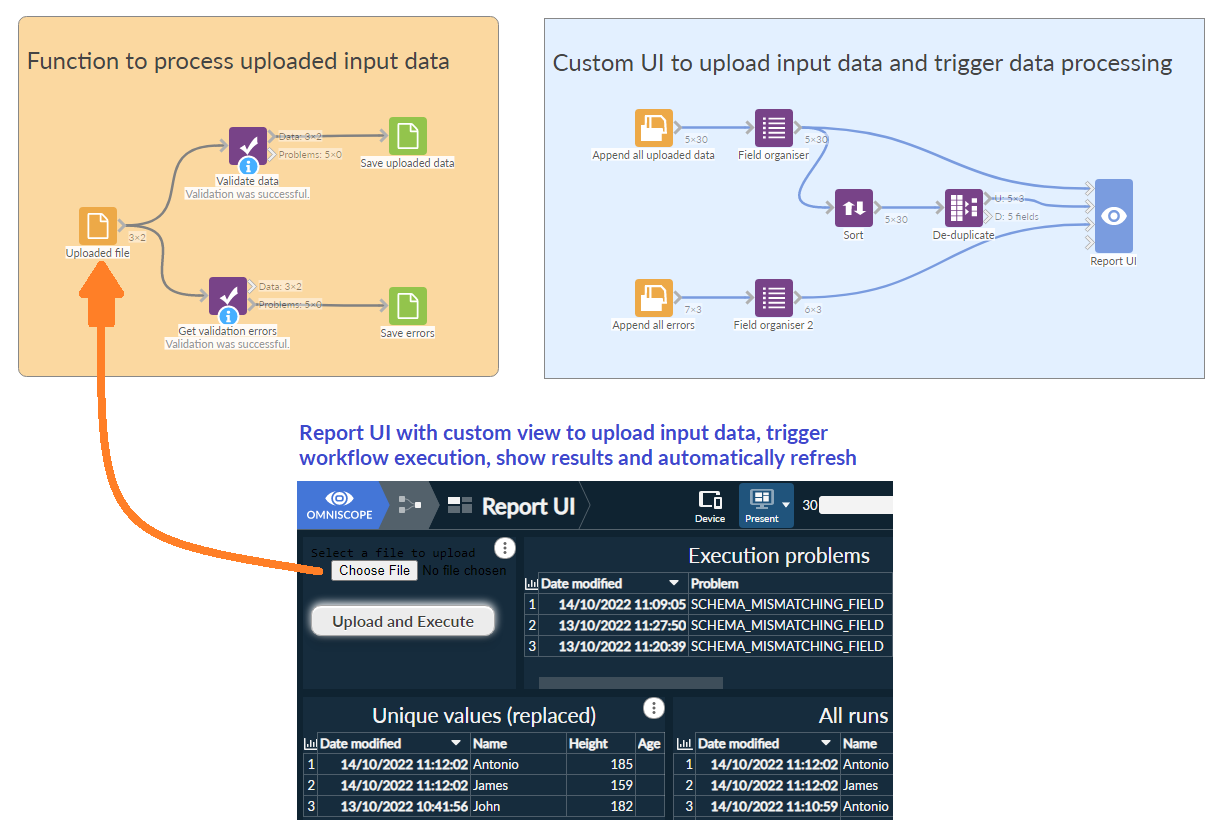
 Upload and Execute
Viewers upload a file from the report, and the workflow checks it, processes it and shows it.
Tool
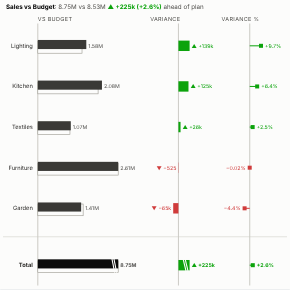
 Variance Chart
Actual against plan, at a glance. Sales against budget, costs against forecast, this year against last, with the variance in money and in percent and the total at the end, in the layout finance teams use in management reports.
Bar visokio-agents
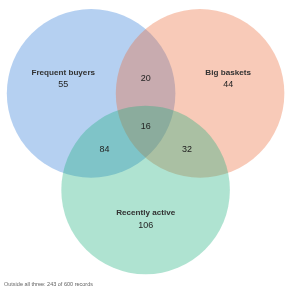
 Venn Diagram
How three conditions overlap, with the count in every region, and a click to select exactly the records in one of them.
Diagram
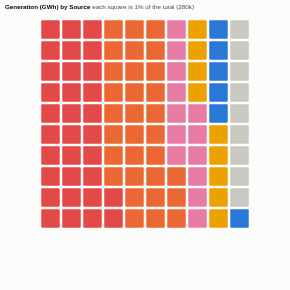
 Waffle Chart
Shares you can count. Part-to-whole as 100 squares, alone or side by side, for summaries that read in a second.
Diagram visokio-agents
 Web View
A web page inside a report, chosen by the data: the page whose address is in the record the viewer filters or selects.
Tool
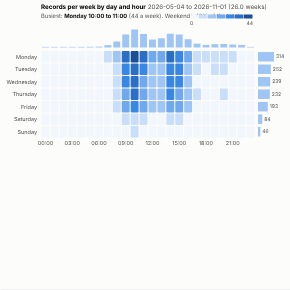
 Weekly Pattern
When are you busiest? See the week at a glance, hour by hour, from any timestamped data, and plan staff, capacity and campaigns around it.
Table visokio-agents
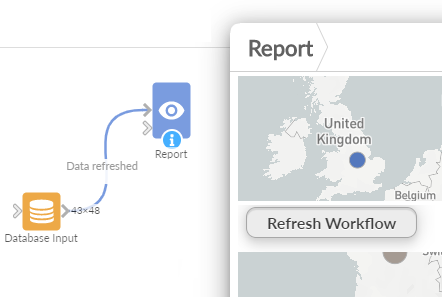
 Workflow Execution
A button in the report that runs the workflow behind it. Viewers refresh the data, or run an export, without opening the workflow.
Tool
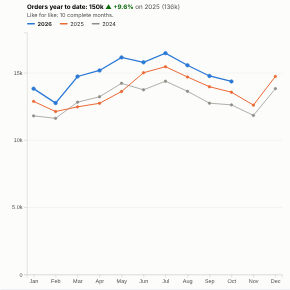
 Year on Year
Are we ahead of last year? This year against previous years, month by month, with a like-for-like year-to-date figure and financial years that start when yours do.
Line and scatter visokio-agents
About these views and the visokio-agents tag (43 of the 69 carry it).