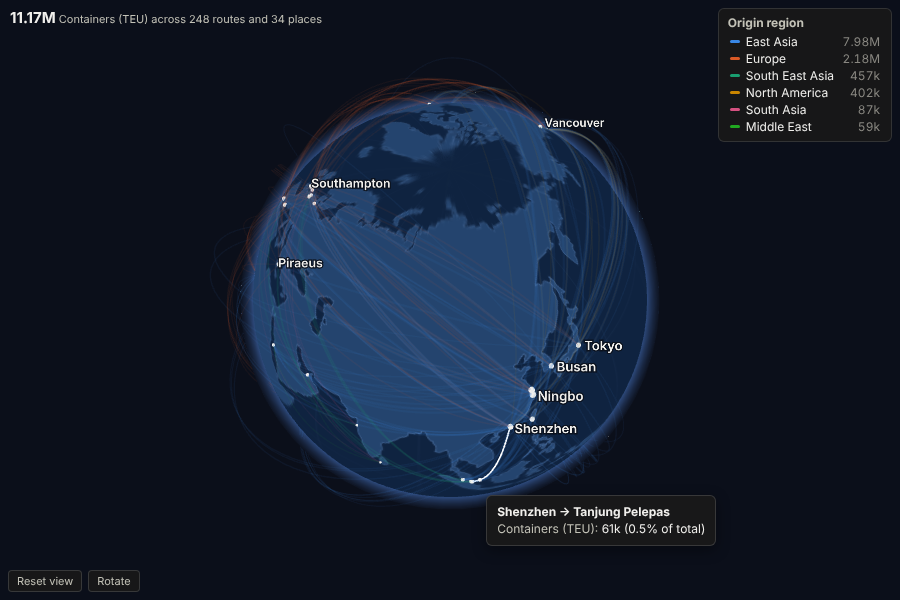
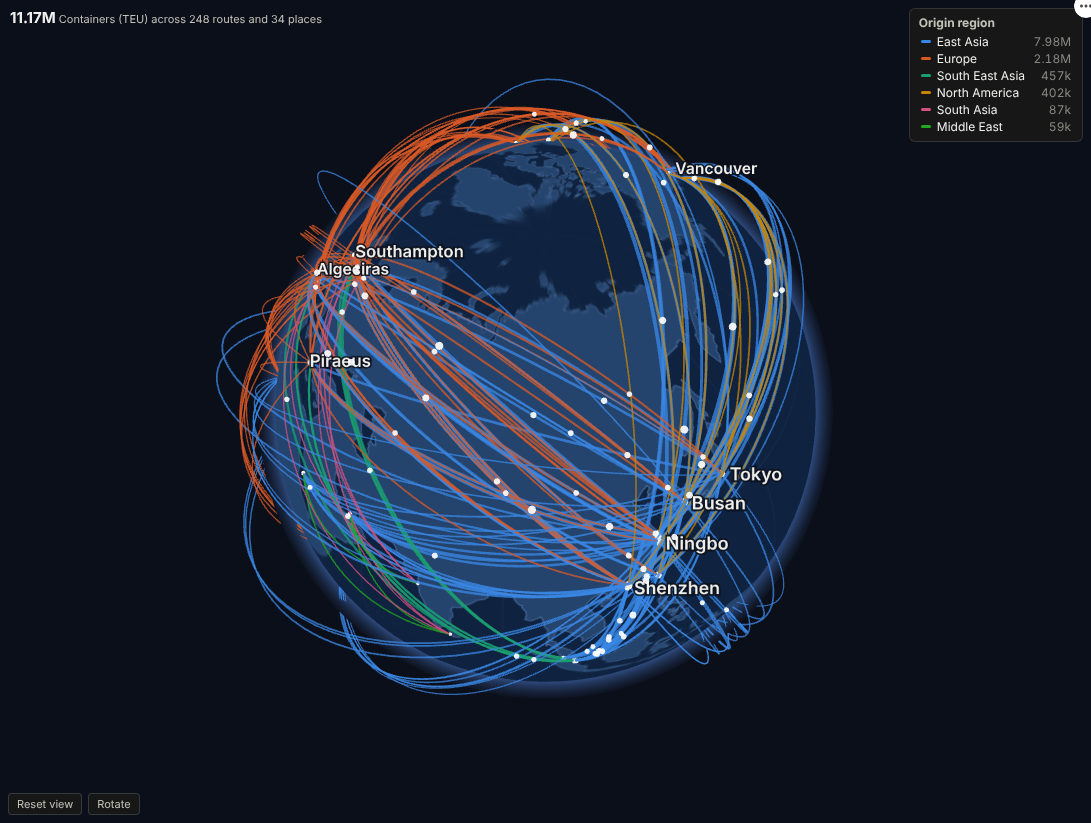
Put your supply chain, trade lanes or payment corridors on a living globe: every route drawn to scale, coloured by region, and one click from the records behind it.
The problem it solves
Flow data is everywhere (shipments, transfers, journeys, orders between sites), and it is hard to read as a table. A flat map with lines gets crowded and distorts long routes; a Sankey loses the geography. Executives and customers want to see the network: where volume concentrates, which lanes are growing, how exposed a business is to one region or one port.
Globe Flows draws each origin-to-destination flow as an arc on a 3D globe, thickness by volume and colour by region or any category, with pulses moving along the largest routes. Viewers turn and zoom the globe themselves. Hovering gives exact volumes, and clicking a route, a port or a region selects those records for every other view in the report.
Where it earns its place
The examples below are illustrative.
| Industry | Flows | Typical question |
|---|---|---|
| Logistics and shipping | Containers or tonnes between ports, depots or hubs | Which lanes carry the volume, and how exposed are we to one corridor? |
| Manufacturing and supply chain | Parts from suppliers to plants | Where do critical components come from, and how far do they travel? |
| Banking and payments | Transfers between countries | Which corridors are growing, and are any unusual for this customer segment? |
| Travel and aviation | Passengers or seats between airports | How does demand on each route compare with capacity? |
| Digital and media | Visitors or orders by country of origin | Where does international demand come from? |
How to use it in Omniscope
- Bring the flow data into a workflow. If it has place names only, add coordinates with the Geocode block or join a lookup table of locations.
- Connect it to a Report block, add a view and choose Globe Flows.
- Set Origin and Destination, the four coordinate measures (mean is the natural choice), and Flow size (for example the sum of Containers).
- Optionally set Colour by field (Origin region, product, carrier).
- Turn and zoom the globe; click a route, place or legend entry to select, and let the rest of the report follow.
Why do this in Omniscope
- Coordinates prepared upstream. Geocoding, joins and aggregation happen in the same workflow, with the Geocode block or a lookup table, so the globe is drawn from tidy data rebuilt the same way on every refresh.
- Follows the report's filters. Filter to European destinations or one product and the arcs and pulses redraw for that subset, each category keeping its colour.
- Lane to shipments. A click on a route, port or legend entry turns the globe into a filter: the shipments table, the cost chart and the KPI tiles beside it show that lane only.
- Arcs you can restyle. It draws up to 3,000 routes, and the arcs, pulses and colours are set in code you can edit.
Data and options
One row per flow (or several per pair, aggregated). Required: origin and destination names and their coordinates.
| Option | What it does |
|---|---|
| Origin, Destination | Names of the two ends; selection filters on these fields |
| Coordinate measures | Latitude and longitude of each end (mean, median, min, max or single value) |
| Flow size | Thickness of each arc |
| Colour by field, Colour flows by | Category colours (eight, then grey) |
| Flows to draw, Label places, Animate flows, Auto rotate | Presentation |
Tested with 3,000 routes between 500 places.
Tested
- Mock harness: 248 routes over 12 months, a selected route, a clicked port, clearing, filtering to European destinations, a small view, colouring by destination, empty data, unconfigured options, and 3,000 routes.
- Real Omniscope server: installed through the Edit View API and configured in a report on the per-route table.