
A bar chart in under 200 commented lines: the worked example to read before writing your own custom view.
The problem it solves
Omniscope's custom view API lets you add any chart or tool to a report, but a first view raises the same questions: where do the user's settings come from, how do I get the data, how do the other views' filters reach me, and how do I make a click select something?
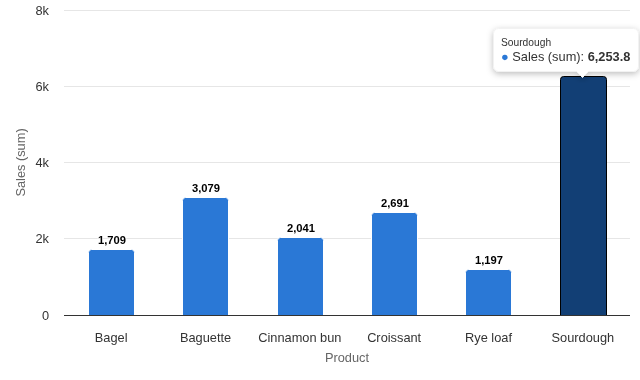
This view answers them in one commented file. It reads its Split and Measure options, runs its own query with the report's filter, hands the result to a charting library, and turns a click on a bar into a selection the rest of the report follows. In the illustrative bakery sales above (invented figures), each bar is a product; clicking Sourdough selects its sales:
Where it earns its place
As a chart, Omniscope's built-in Bar view does more. The point of this view is its code: it is meant to be opened, read and changed.
| You want to learn | Where to look in index.html |
|---|---|
| Reading options | context.options.items in query() |
| Querying with the report's filter | the queryRequest object |
| Drawing with a library | render() |
| Selecting records | select() |
How to use it in Omniscope
- Connect data with a text field and a numeric field to a Report block.
- Add a view and choose Custom View Demo; set Split and Measure.
- Open the view in the View Designer to see
index.htmlandmanifest.json. - Change the drawing, add an option in
manifest.jsonand read it inquery(), then reload the view to see the change.
Why do this in Omniscope
- A chart becomes part of a report with one file. The few lines that pass the report's filter and send a selection back are all it takes for a library chart to filter, and be filtered by, the built-in views beside it.
- The query engine does the sums. The view asks for one grouping and one measure and gets back the same totals a built-in Bar view of the same data shows; it never handles the raw records.
- Changed in the View Designer, tried on real data. Edit
index.htmlin the project's View Designer and the report's own data, filters and selections exercise the change straight away; no separate test page or exported sample.
Data and options
A text field and a measure.
| Option | What it does |
|---|---|
| Split | One bar per value |
| Measure | The height of each bar |
| Pane X, Pane Y | Optional: one chart per value |
Tested
Mock harness: the sum per product checked against the source data, record count across all 300 sales, filtering to one shop, selecting a bar, clicking it again and clicking the background to clear, a 200 by 140 pane, 20,000 records (total 1,010,000), empty data and unconfigured options.