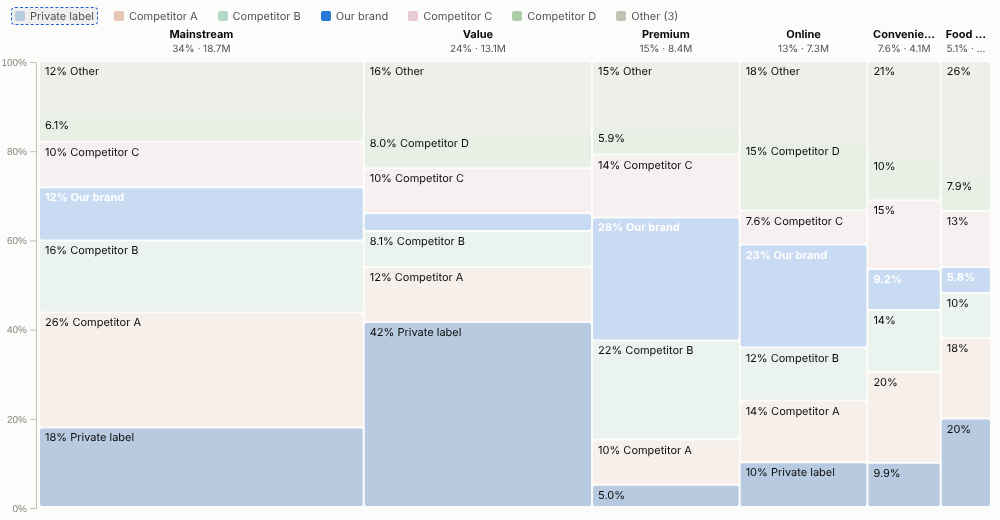
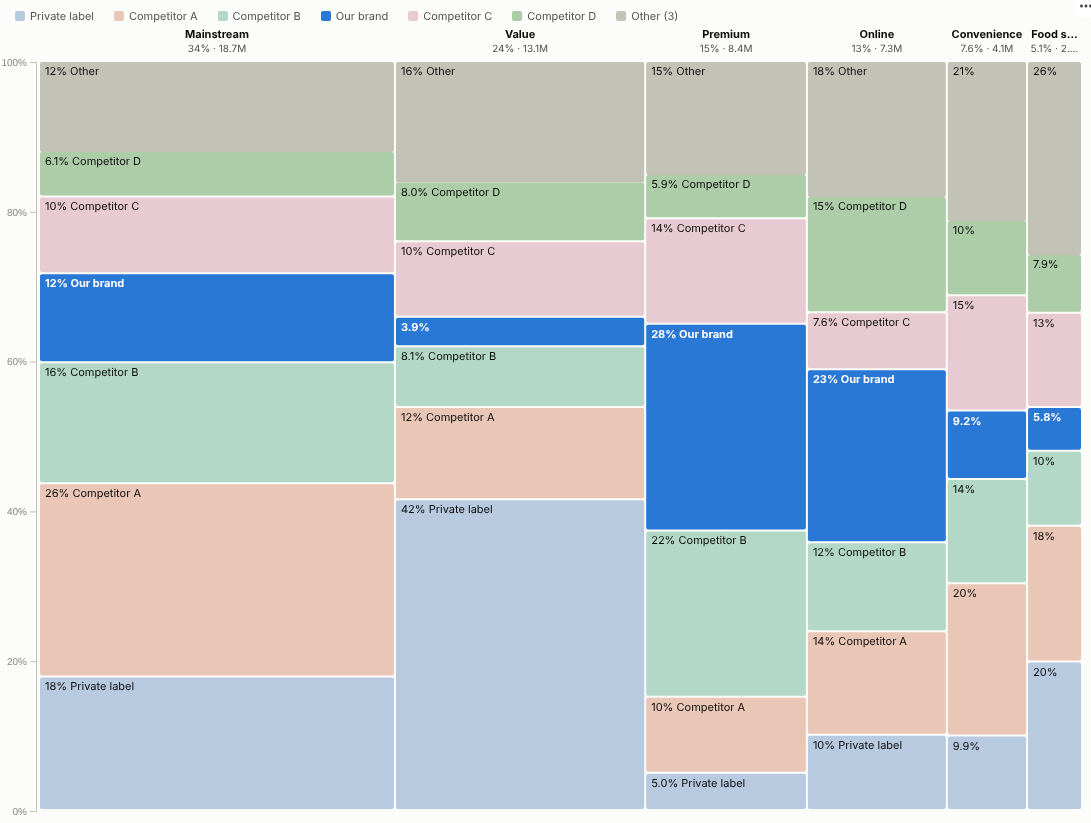
The one-page market map: how big each segment is, who wins in each, and where your brand is strong or missing, in a single chart.
The problem it solves
Strategy questions have two dimensions at once. How large is each market segment, and what share do we hold in it? A stacked bar chart shows the shares but treats every segment as the same size; a pie or treemap shows size but hides the mix. Teams end up with two charts and a lot of pointing.
A Marimekko chart answers both: column width is the segment's share of the whole market, and the blocks inside show who holds it. In the illustrative market above, "Our brand" is highlighted: it holds 28% of Premium and 23% of Online but only 4% of Value, the second-largest segment, which is where the growth conversation should start. Turning off the highlight shows every competitor in its own colour.
Where it earns its place
The examples below are illustrative.
| Function | Columns | Stack | Question |
|---|---|---|---|
| Sales and marketing | Market segment, channel or region | Brand or competitor | Where are we under-represented in large segments? |
| Strategy and M&A | Sector or geography | Company | Which markets are concentrated or fragmented? |
| Finance | Business unit | Product line | Which units drive revenue, and with what mix? |
| Procurement | Spend category | Supplier | Where is spend concentrated with one supplier? |
| HR | Department | Grade or contract type | How does workforce mix differ between departments? |
How to use it in Omniscope
- Connect sales, market or spend data to a Report block (for example market research data joined to your own sales in the workflow).
- Add a view and choose Marimekko.
- Set Columns (for example Segment), Stack (for example Brand) and Value (for example sum of Sales).
- Type your brand in Highlight to show it against muted competitors, and choose how many Stack categories to show.
- Click a block, a column or a legend entry to select it for the rest of the report; filter by region or quarter to see how the map changes.
Why do this in Omniscope
- No yearly slide. Drawn from the workflow, the market map follows each refresh and re-cuts by region, period or channel with a filter.
- Own and market data on one basis. Internal sales are joined with syndicated or survey data in the workflow and summed per combination (tested with 20,000 rows).
- Block to detail. Selecting a block filters the tables and trends beside it, so "why so small in Value?" is answered on the same page.
- Labels in the code. Highlight and segment labels are options; growth figures on each column, for example, can be added to the view's source.
Data and options
Two categories and a positive measure; many rows per combination are summed.
| Option | What it does |
|---|---|
| Columns, Stack, Value | The two categories and the measure |
| Stack categories | Largest N shown; the rest grouped as Other |
| Highlight | Emphasises one series |
| Sort columns, Show segment labels | Presentation |
| Pane X, Pane Y | One chart per region, period or channel |
Tested with 20,000 rows, 50 columns and 40 series.
Tested
- Mock harness: highlighted and full-colour versions, block, series and column selection, clearing, filtering to one region, a small view, empty data, unconfigured options, and 20,000 rows.
- Real Omniscope server: installed through the Edit View API and configured in a report.