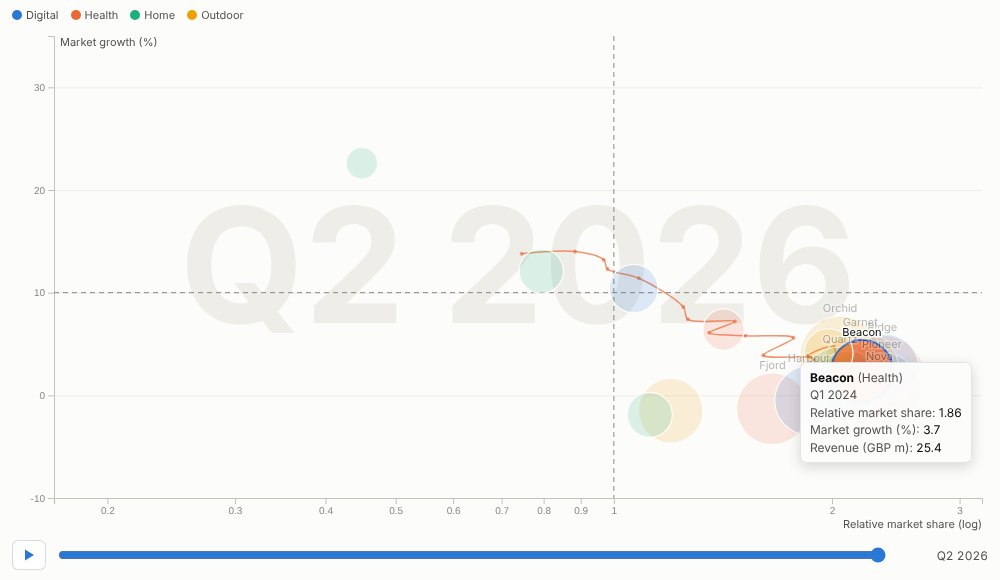
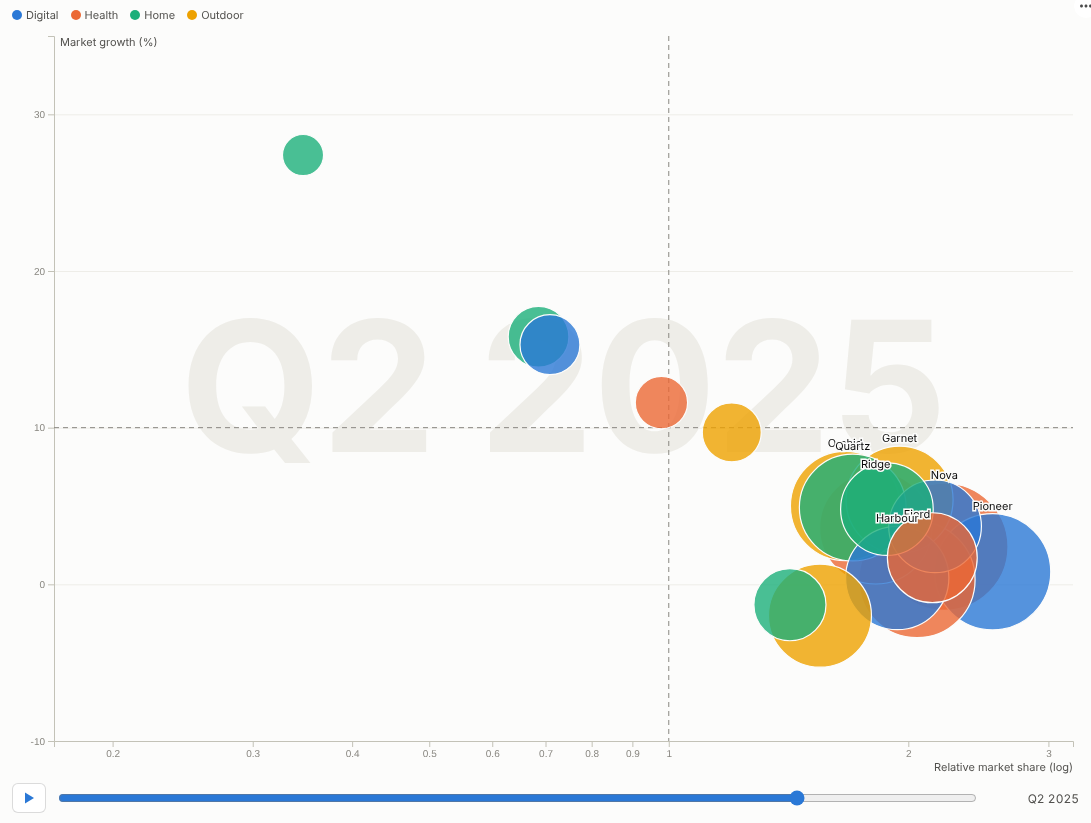
Watch your portfolio move. Every product, store or customer as a bubble, travelling through two dimensions over time, with trails that show where each one came from.
The problem it solves
Strategy reviews ask how things have moved, not just where they are: which products have become stars, which stores have improved conversion without sacrificing basket size, which customers are drifting from loyal to occasional. A static scatter chart shows one moment; a set of them per quarter makes the audience do the animation in their heads.
Motion Bubbles plays the movement. Two measures place each bubble, a third sets its size and a category colours it; the chart animates smoothly from period to period with the date large in the background. Hover or select a bubble and its trail appears. In the illustrative portfolio above, plotted as a growth-share matrix (relative market share on a log scale against market growth, with reference lines at 1 and 10%), products enter as question marks, become stars and settle as cash cows, and the trail of any product shows its journey.
Where it earns its place
The examples below are illustrative.
| Use | Bubbles | X, Y, size |
|---|---|---|
| Portfolio strategy | Products, brands, business units | Relative share, market growth, revenue |
| Retail performance | Stores | Conversion, average basket, sales |
| Customer value | Customer segments or accounts | Frequency, value, number of customers |
| Operations | Sites, lines | Cost per unit, output, headcount |
| Public sector and economics | Areas, regions | Two indicators, population |
How to use it in Omniscope
- Connect data with an item, a period and the measures to a Report block (for example quarterly product data joined to market data in the workflow).
- Add a view and choose Motion Bubbles.
- Set Bubbles, Time (for a date, choose unique values or quarters), X axis, Y axis, and optionally Size and Colour by.
- For a quadrant chart, add X reference line and Y reference line; use a log axis for ratios.
- Press play in the meeting; pause on a quarter, select a bubble to show its trail and its detail elsewhere in the report.
Why do this in Omniscope
- Next quarter extends it. The animation runs on the workflow's data, so next quarter's figures add a frame after the refresh.
- Product data joined to market data. Quarterly product figures are joined to market growth in the workflow and shown in a growth-share layout (tested with 1,000 bubbles over 40 periods).
- Pause, select, follow. During a presentation, pause on a quarter and select a product: its trail appears and the rest of the report follows; a filter to one business unit replays the motion for that subset.
- Quadrants your way. Reference lines and log axes are options; quadrant labels or another layout can be written into the view's code.
Data and options
An item, a period and two measures; optionally size and colour.
| Option | What it does |
|---|---|
| Bubbles, Time | Items and frames |
| X axis, Y axis, Log axes | Position and scales |
| Size, Colour by | Bubble area and colour |
| Reference lines | Quadrant lines |
| Labels, Trails, Seconds per period, Play automatically, Loop | Display and playback |
Tested with 1,000 bubbles over 40 periods.
Tested
- Mock harness: the growth-share matrix with log axis and reference lines, selection with a trail, play and pause, clearing, filtering to one business unit, a small view, linear axes without size or colour, empty data, unconfigured options, and 1,000 bubbles over 40 periods.
- Real Omniscope server: installed through the Edit View API and configured in a report.