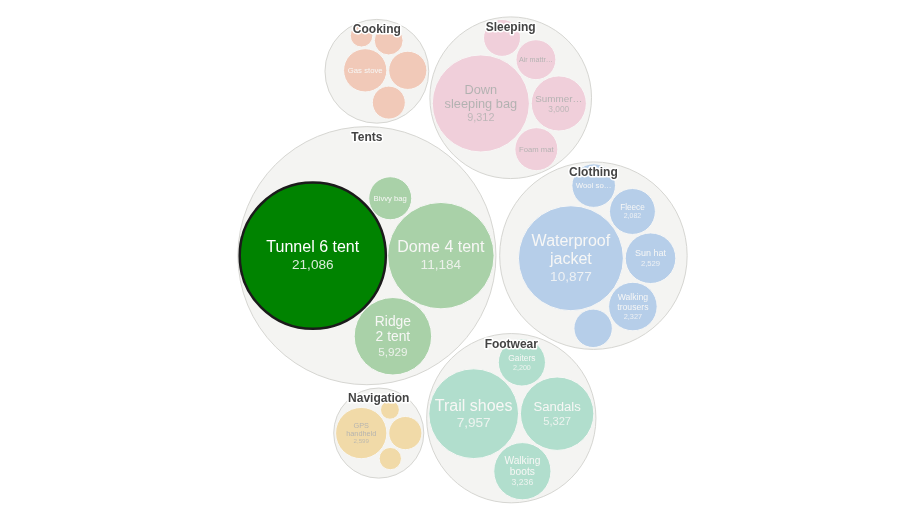
Which few items make up most of the total? Packed bubbles sized by a measure, optionally grouped by category, so the big contributors stand out at once.
The problem it solves
A long bar chart ranks every item exactly, but with dozens of items the eye has to read down the list to see which ones matter. A packed bubble chart trades exact comparison for an overall picture: each item is a circle whose area follows its value, so a handful of large bubbles among many small ones shows at once where most of the total comes from.
In the illustrative shop above (invented figures), one tent brings in about a fifth of the revenue. Grouping the bubbles by category adds a second level: how the categories compare, and which products make up each one.
Where it earns its place
Omniscope's Packed bubble view draws the same kind of chart and is better integrated with the report; this view is a short D3 file that is easy to change. Use a bar chart when the exact ranking or small differences matter. Use the bubble chart when there are tens to hundreds of items, a few of them much larger than the rest, and the question is "where does most of it come from?", with a category grouping when the items belong to groups.
The examples below are illustrative.
| Team | One bubble per | Size | Grouped by |
|---|---|---|---|
| Retail | Product | Revenue | Category |
| Procurement | Supplier | Spend | Spend category |
| HR | Team | Headcount | Department |
| Digital | Page | Visits | Site section |
How to use it in Omniscope
- Bring the data into a workflow and connect it to a Report block.
- Add a view and choose Bubble Chart.
- Set One bubble per, for example Product, and Size, for example the sum of Revenue.
- Optionally set Group and colour by, for example Category, and choose what Labels show.
- Click a bubble or a group to select it in the rest of the report.
Why do this in Omniscope
- Sized by the same engine as the table next to it. Each bubble's value is aggregated by Omniscope's query engine from the workflow's output, so the tooltip's figure and share of the total match a table of the same data, and are recomputed on every refresh.
- Part of the report. The bubbles follow the report's filters, keep their colours when filtered, and a click on a bubble or a whole category filters the other views.
- A starting point for your own packed layout. The view is a short HTML file using D3's pack layout; open it in the View Designer to change the grouping levels, the labels or the colours.
Data and options
A field for the bubbles, a measure to size them and, optionally, a category; up to 2,000 bubbles.
| Option | What it does |
|---|---|
| One bubble per | One bubble per value |
| Size | The bubble's area; zero, negative and empty values are left out |
| Group and colour by | One circle per category, holding its bubbles, and their colour |
| Labels | Name and value, name only, or none |
| Pane X, Pane Y | One chart per value |
Tested
Mock harness: one bubble per product (28), the largest bubble and its tooltip checked against the source data (21,086), the category totals (Tents: 40,026), one colour per category, selecting a bubble and a group, clearing by clicking the bubble again and by clicking empty space, filtering to one category (the bubble's colour unchanged), changing the Size measure and the labels, a 200 by 140 pane (every bubble inside the view, no label wider than its bubble), 1,500 bubbles with 15 negative values left out, 2,500 bubbles refused with a message, empty data and unset options.