
Omniscope custom block · Preparation · Standardisation
Prices, percentages and days on one scorecard? Rescale each field to 0 to 1, lowest to highest, so they can be compared, weighted and added up.
R · data.table · install data.table on the server's R if missing
The problem it solves
A buyer compares twelve suppliers on price index (95 to 112), punctuality (85% to 99%), defects per thousand (0.6 to 5.6) and lead time (4 to 14 days). Added up as they are, the price index swamps everything else, and a chart of the four side by side is unreadable.
This block rescales each field to run from 0 (the supplier with the lowest value) to 1 (the highest), so every field counts on the same scale.
- 12 suppliers in, 12 out, the same fields in the same order
- 4 fields rescaled, each from exactly 0 to exactly 1
- 1 missing punctuality figure left missing; the other eleven are still rescaled
How it works
- For each chosen field: (value − lowest) / (highest − lowest).
- Missing values stay missing and are ignored when finding the lowest and highest.
- A field whose values are all the same becomes 0, and the block's message says so.
What goes in
Supplier scores
12 invented suppliers with four measures.
| Supplier | Category | Price | Punctuality | Defects | LeadTime |
|---|---|---|---|---|---|
| Northwind Fasteners | Hardware | 104.5 | 96.2 | 1.8 | 6 |
| Kestrel Plastics | Packaging | 112.3 | 88.0 | 0.9 | 12 |
| Fernhill Paper | Packaging | 95.4 | 97.8 | 2.4 | 5 |
| Marsh Lane Metals | Hardware | 101.2 | 4.1 | 8 | |
| Brookside Electrical | Electrical | 99.7 | 85.4 | 5.6 | 14 |
| Harbourside Labels | Packaging | 103.0 | 99.1 | 0.6 | 4 |
12 rows in the sample file.
The options
| Option | Demo setting | What it does |
|---|---|---|
| Fields to standardise | Price, Punctuality, Defects, LeadTime |
The number fields to rescale; each is replaced by its rescaled values. |
What comes out
Standardised records (selected rows, to three decimal places)
| Supplier | Price | Punctuality | Defects | LeadTime |
|---|---|---|---|---|
| Northwind Fasteners | 0.538 | 0.788 | 0.24 | 0.2 |
| Kestrel Plastics | 1 | 0.19 | 0.06 | 0.8 |
| Fernhill Paper | 0 | 0.905 | 0.36 | 0.1 |
| Marsh Lane Metals | 0.343 | 0.7 | 0.4 | |
| Brookside Electrical | 0.254 | 0 | 1 | 1 |
| Harbourside Labels | 0.45 | 1 | 0 | 0 |
12 records. Higher still means a higher value: Brookside's 1 for Defects is the most defects. For a score where 1 is best, take 1 - value for Price, Defects and LeadTime in a formula.
Where it pays off
Procurement: Supplier scorecards
Put price, delivery, quality and lead time on one scale before weighting them into a score.
Analytics: Before clustering or nearest neighbours
Stop a field with large numbers (revenue) outweighing one with small numbers (visits per week) in a distance-based method.
Reporting: Comparing measures on one chart
Show several measures in different units on one axis, such as each store's sales, footfall and margin as a share of the range.
HR and operations: Indices
Combine measures such as absence, overtime and turnover into an index per team or site.
Use cases describe typical scenarios and are illustrative; the sample data is invented.
Why do this in Omniscope
- Scores straight into the ranking. The rescaled fields feed a Field Organiser formula for the weighted score and the Report's ranking table, straight from the supplier data.
- The scale follows the data. Each run rescales on the current lowest and highest values, so a new supplier or a new month's figures are placed on the same 0 to 1 range without editing anything.
- A short R script. The rescaling is a few lines of R in the block; open it in the block's editor to change the target range or flip a field so that lower is better.
How it fits into an Omniscope workflow
Supplier data (File or Database) → Standardise → Field Organiser (score formula, 1 - value for lower-is-better fields) → Sort → Report
Choose the number fields to rescale; the others pass through. The chosen fields are replaced: add a copy of each first (a formula field in Field Organiser) if the Report also needs the original values.
Try it
- Open the demo project (
demo.ioxon the demo server, or importdemo.iozfrom this folder): 12 suppliers with four measures. - The question: how do the suppliers compare on each measure, on one scale?
- Open Standardise: fields Price, Punctuality, Defects and LeadTime. Run it.
- Look at the output: each field runs from 0 to 1; Kestrel Plastics has the highest price (1) and Fernhill Paper the lowest (0); Marsh Lane Metals' punctuality stays empty.
- Remove LeadTime from the fields and run again: LeadTime passes through as days.
Running in Omniscope
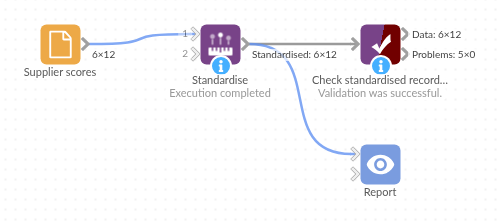
The demo project's workflow: the sample data, the block, and a Validate data check on its output.
Language and libraries
R. It uses the data.table package.
data.table is not part of base R: install it on the Omniscope server's R if it is missing (install.packages("data.table")).
Tested
The block is covered by automated tests that run its script against a stand-in for Omniscope's R API: the sample suppliers, missing values, fields whose values are all the same, whole numbers, negative numbers and field names with spaces, a field of only missing values, empty input, text fields, no fields, a missing field and no input, and 500,000 records.